WHAT IS SPC?
Statistical process control (SPC) is a powerful collection of problem-solving tools useful in achieving process stability and improving capability through the reduction of variability.
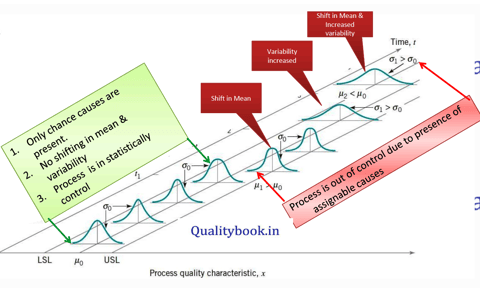
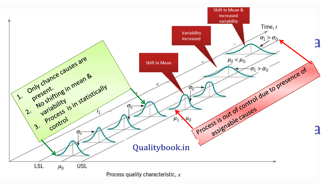
Types of source of Variability:
1. Chance Cause of variability
Chance cause of variability is the inherent variability of process due to uncontrollable factors like environment, difference batch of raw material etc. If any process work with in chance cause of variability then process is called statistically controlled process.
2. Assignable Cause of variation
Assignable cause of variation is the variability due to controllable process factors. If any process work with in assignable cause of variation then process is called out of control process.
OBJECTIVE OF SPC:
SPC is used to detect assignable cause of variation & take corrective action after investigation for assignable cause. The objective of an SPC-based variability reduction program is continuous improvement on a weekly, quarterly, and annual basis.
SPC is not a one-time program to be applied when the business is in trouble and later abandoned. Quality improvement that is focused on reduction of variability must become part of the culture of the organization. OCAP (Out of Control action plan) required in flow chart to address assignable cause effectively.
HOW TO DETECT ASSIGNABLE CAUSE?
Assignable cause can be easily detected by effective use of control chart in process.
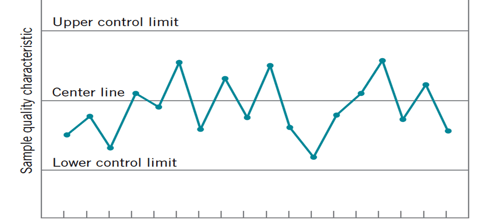
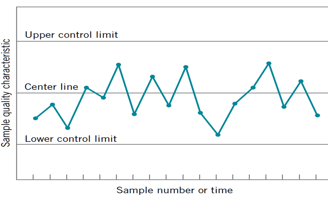
WHAT IS CONTROL CHART?
Control chart is prepared by plotting average of Quality characteristic V/S Sample number or time on a graph between UCL (Upper Control Limit) & LCL (Lower control Limit)
Elements of a Successful SPC Program
1. Management leadership
2. A team approach, focusing on project-oriented applications
3. Education of employees at all levels
4. Emphasis on reducing variability
5. Measuring success in quantitative (economic) terms
6. A mechanism for communicating successful results throughout the organization
Procedure to construct a control chart:
1. Identify what to measure & control
Example: Width, ID, OD etc.
2.Define sample size and frequency
Example: Sample Size- 5 Number Frequency- 1 hour
3. Determine rational subgroups (only common cause variations within group)
Example: Subgroups- 20 to 25 ; Consecutive samples within each subgroup must
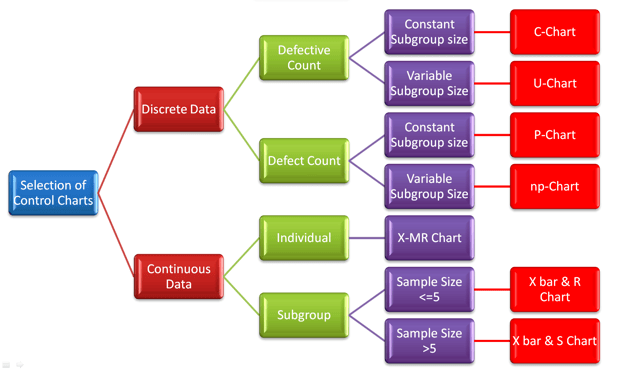
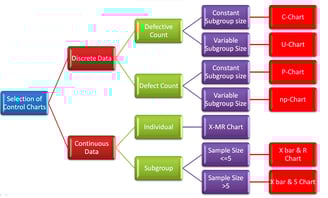
4. Select the appropriate control chart
Select the control according to type of data & no. of sample size
5.Take initial set of data from the process & determine control limits
6. Verify stability and if stable lock the control limits (if in control)
7. Develop an out of control action plan (OCAP)
8. Train the people involved
9.Continue to monitor the process using control charts
Tests for Special Causes
1 point more than 3 standard deviations from centerline
9 points in a row on same side of centerline
6 points in a row, all increasing or all decreasing
14 points in a row, alternating up and down
2 out of 3 points > 2 standard deviations from centerline (same side)
4 out of 5 >1 standard deviation from centerline (same side)
15 points in a row within 1 standard deviation of centerline (either side)
8 points in a row > 1 standard deviation from centerline (either side)