
nP-Chart or number of non-confirming chart
In process quality check, we inspect many quality characteristic of a product to verify the product parameters. If all product parameters meets with the requirement or standard then product called as a conforming product. And if any parameters does not meet the requirement then product is called as a non-confirming product. A product may have one or more product parameters or requirements.
Let us consider a sample of 50 numbers taken from a batch during processing & during inspection 10 numbers from sample found non-confirming. Then fraction of non-confirming (P) is 0.2 or in percentage 20%.
It is also possible to base a control chart on the number nonconforming rather than the fraction nonconforming. This is often called an number nonconforming (np) control chart.
A control chart used for this number of non confirming is called as nP-Chart. nP-chart is based on the Binomial Distribution.
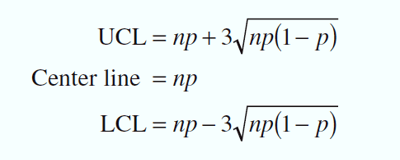
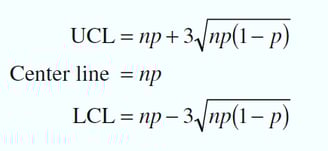
Calculation of Control Limit
Example:
m=30 samples of n = 50 cans each were selected at half-hour intervals over a three-shift period in which the machine was in continuous operation. The data are shown in below Table
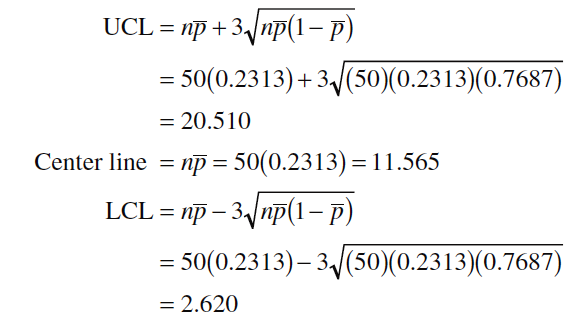
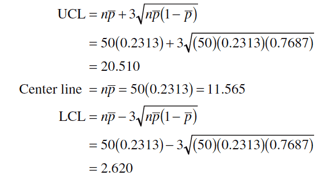
Calculation
Since the n=50 samples contain nonconforming products, Using as an estimate of the true process number of nonconforming, we can now calculate the upper and lower control limits as given below:
Construction of P-Chart
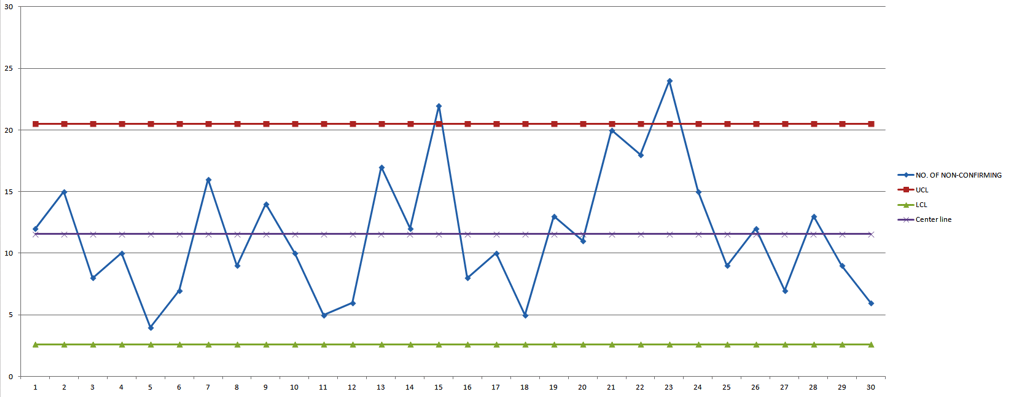
Plot the number of non-confirming with UCL (upper control limit) & (LCL) Lower control limit.
The control chart with center line at and the above upper and lower control limits is shown below. The sample fraction nonconforming from each preliminary sample is plotted on this chart.
We note that two points, those from samples 15 and 23, plot above the upper control limit, so the process is not in control. These points must be investigated to see whether an assignable cause can be determined.
A nonconforming item is a unit of product that does not satisfy one or more of the specifications for that product. Each specific point at which a specification is not satisfied results in a defect or nonconformity. There are many practical situations in which we prefer to work directly with the number of defects or nonconformities rather than the fraction nonconforming. These include the number of defective welds in 100 m of oil pipeline, the number of broken rivets in an aircraft wing, the number of functional defects in an electronic logic device, the number of errors on a document, and so forth.
It is possible to develop control charts for either the total number of nonconformities in a unit or the average number of nonconformities per unit.
This type of Chart Can be classified as C-Chart or U-Chart